Unlocking unprecedented insights
Equipping assets with Vista cameras and having data processed by the StoreAware platform will give unprecedented insights into everyday store execution levels. This has been demonstrated by several clients and here we show examples from separate cases where the data insight brought enormous upside value.
The Context
Frequently we engage with brand teams from different product categories who are eager to explore the added value that CoolR’s ecosystem of solutions can unlock.
Over this page we will outline some exemplary insights and learnings that were generated to serve as an illustration of our capabilities and an inspiration for you.

Identify & Estimate
Key Improvement Drivers
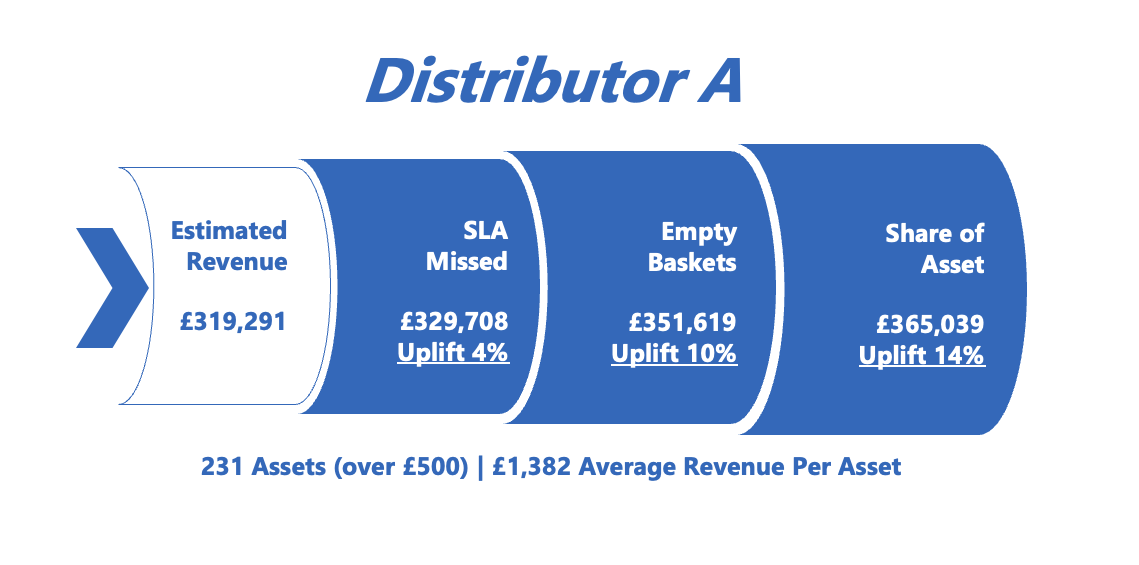
In this example we analyzed the data from a single UK distributor, responsible for 231 connected assets. They would see a 4% growth in those outlets if the speed of fulfilment would be in line with the service level agreement, another 6% (taking it to 10% total) if the out-of-stocks and asset utilisation were acted upon! Finally, it could all be brought to 14% total growth if the team managed to increase the share of asset to target levels.
Imagine having this sort of data at your finger tips for each asset, each account, each region – every day!
Sales Upside Value by Outlet
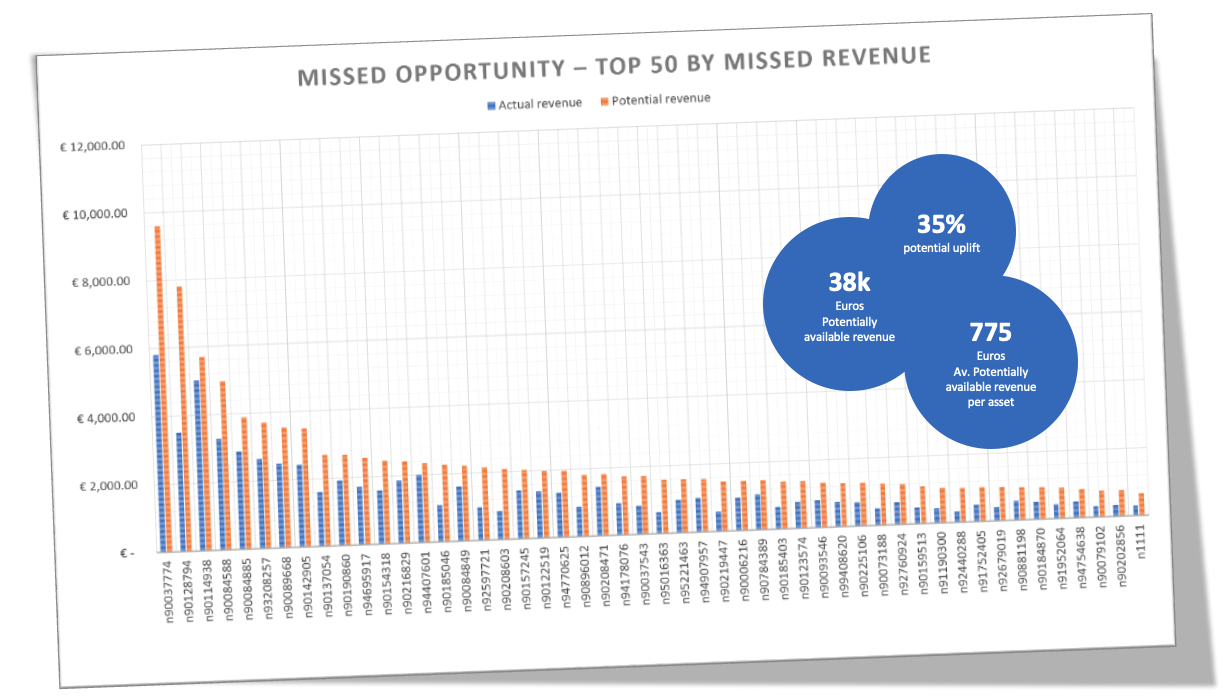
Employing StoreAware equipped this client with deep insights into the performance of each asset and store even identifying what the sales upside is for each store.
Our AI-engine allows to get to this unprecedented level of understanding as we have daily information on product presence, share of shelf, product velocities etc. We can then model the sales value if you optimised performance so you can make decisions balancing cost and return.
In this specific case you see a ranking of outlets by their sales upside. On average it amounts to an amazing 35% growth or €775 additional revenue for each!
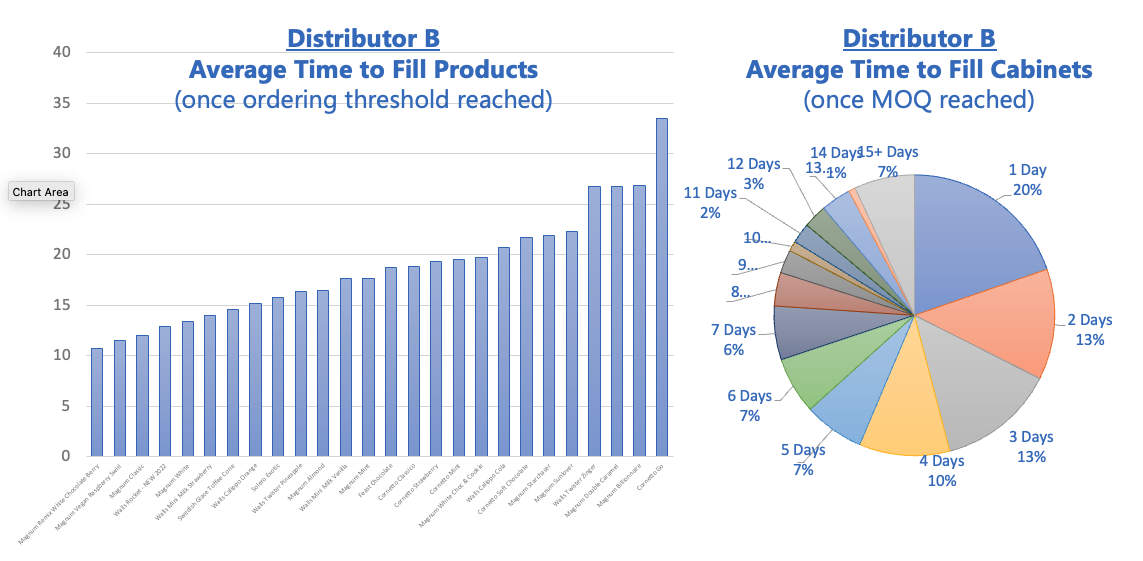
Tracking Performance of Fulfilment Partners
CoolR’s systems enable yet another insight, to learn about the speed of fulfilment: how long it takes for products to be re-merchandised in an asset after they run low or even after the order was triggered.
In this specific case one of the distributors did not perform in line with the agreed service level agreement. As you can tell from the charts on the right we have two issues:
First, on average single products are low or even out of stock for about two weeks till an order for the whole store is triggered! This can be caused by too high MOQs or by too complex a portfolio in the store.
Secondly, it took on average another 4-5 days from the moment an order was triggered to when products landed on shelf. A huge opportunity to improve.
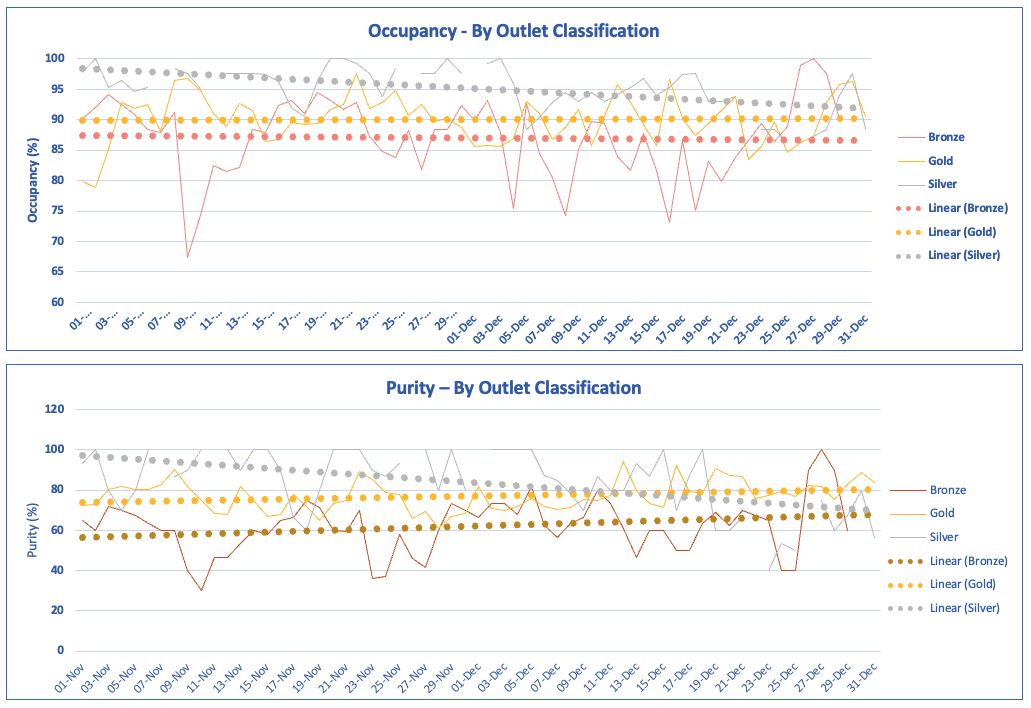
Continuous Insights on Execution
A leading CSD company gained very detailed insights into the actual execution quality across every single asset across time. We learned that asset occupancy on average across all days was fluctuating significantly and on average was around the 90% mark. Note, that single day audits would have given you rather random, non-representative results.
Interestingly Gold outlets performed worse than Silver outlets which points to an issue in sales & fulfilment cycles as you would surely want your top outlets to perform best even if the consumer sell-out is higher and thus more challenging.
In terms of asset purity the client faced another opportunity with a good 20% uplift possible with more stringent execution. Particularly the bronze outlets show about a third of the assets being used for other products.